Traffic Drop Diagnoser
Every week your traffic stays down costs you leads, revenue and rankings that get harder to recover. Connect your Google Analytics and get the exact diagnosis — root causes identified, affected pages ranked by loss, and a recovery plan delivered to your inbox.
What Is This Tool?
A 30% traffic drop left unchecked for 4 weeks can cost a mid-size site $5,000-$20,000 in lost revenue — and every day without a diagnosis makes recovery harder as competitors fill the gap. The Traffic Drop Diagnoser connects to your Google Analytics, cross-references 90 days of data with algorithm update timelines and on-page changes, and delivers a data-backed diagnosis: the exact channels affected, the pages hit hardest, and a prioritized recovery plan so you stop guessing and start fixing.
How It Works
Your URL runs through 5 AI stages. Each one handles a specific part of the analysis.
Data Pull
Pulls 90 days of traffic data: pageviews, sessions, sources and top pages from Google Analytics.
Trend Detection
Identifies significant drops week-over-week and month-over-month across channels and pages.
Page Scan
Scrapes the top 5 affected pages to detect content changes, meta tag issues and structural problems.
Root Cause
Correlates traffic patterns with page changes, algorithm updates and seasonal trends.
Recovery Plan
Generates a prioritized action plan with timeline estimates and expected impact.
What You Get
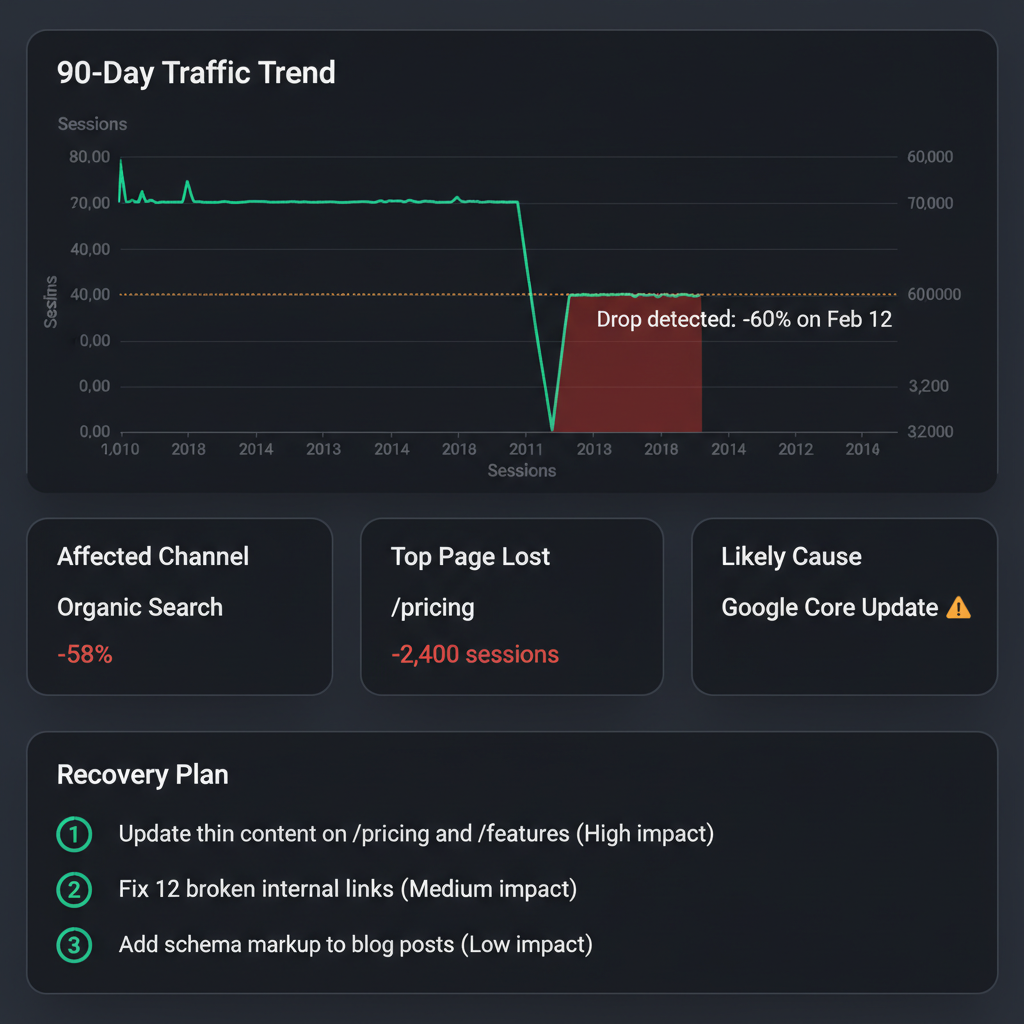
90-Day Trend Analysis
Daily traffic plotted across 90 days with drop points annotated and quantified.
Channel Breakdown
Organic, paid, referral and social traffic analyzed separately to isolate the affected channel.
Page-Level Impact
The 10 pages that lost the most traffic ranked by absolute session loss.
Algorithm Correlation
Drop timing cross-referenced with known Google algorithm updates.
Content Change Detection
Scraped pages compared against cached versions to find unintended changes.
Recovery Timeline
Step-by-step recovery plan with effort estimates and expected traffic impact per action.
Not for you if...
Your site gets less than 1,000 monthly sessions (not enough data for pattern detection), you run a single-page site with no subpages to analyze, or you have less than 30 days of Google Analytics data connected.
Free during beta
This tool runs a 5-stage AI pipeline that costs us real compute per diagnosis. It is free while we refine the accuracy of the root cause engine. Once we hit our accuracy target, it moves to a paid plan.
Is This For You?
Frequently Asked Questions
Run It Now — Free
Enter your details below. Results are delivered straight to your inbox.
Every tool works the same way
Enter a URL or connect your data, get results. Browse the full collection and find the right analysis for your next project.
Explore All Tools