Weekly Analytics Brief
Your team wastes hours every week pulling GA numbers that nobody acts on until something breaks. Connect your Analytics, get a brief that catches problems in week 1 — not month 3.
What Is This Tool?
Marketing teams waste 2-4 hours every week pulling analytics data, formatting slides, and writing summaries that nobody reads until something breaks. By then, the traffic drop is 3 weeks old and recovery takes months. The Weekly Analytics Brief connects to your Google Analytics and generates the report automatically — with anomaly detection that catches problems while they're still fixable.
How It Works
Your URL runs through 4 AI stages. Each one handles a specific part of the analysis.
Data Pull
Pulls this week vs. last week: sessions, users, pageviews, top pages and traffic sources from your Google Analytics.
Anomaly Detection
Flags significant changes against a 4-week rolling baseline and highlights statistical outliers.
Highlights
Extracts the top 3 wins and top 3 concerns with concrete numbers and percentage changes.
Brief
Compiles an executive summary with data tables, trend charts and 3 prioritized recommendations.
What You Get
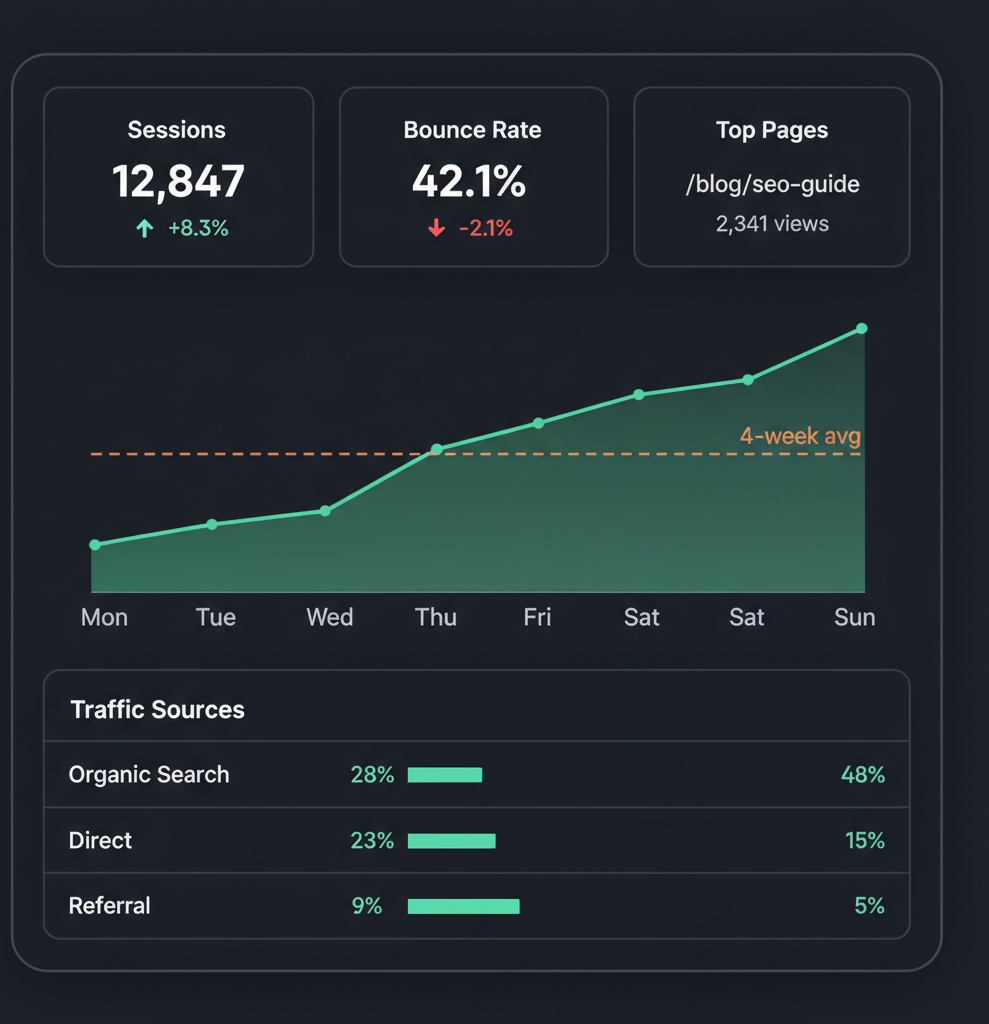
Week-over-Week Comparison
Sessions, users, pageviews and bounce rate compared to last week with percentage deltas.
Anomaly Flags
Statistically significant traffic spikes or drops detected against your 4-week baseline.
Top Pages Report
Your 10 highest-traffic pages ranked by sessions with trend indicators.
Traffic Source Breakdown
Organic, direct, referral and social traffic split with week-over-week changes.
Executive Summary
A 3-paragraph brief you can forward to stakeholders without editing.
Action Items
3 specific, prioritized recommendations based on this week's data.
Not for you if...
You have fewer than 500 sessions per week (not enough data for meaningful anomaly detection), need real-time alerting (this is a weekly summary), or want custom dashboards (use Looker Studio for that).
Free during beta
Limited to 50 briefs per week while we scale infrastructure. No credit card, no commitment — just connect your GA and get your first brief in 60 seconds.
Is This For You?
Frequently Asked Questions
Run It Now — Free
Enter your details below. Results are delivered straight to your inbox.
Every tool works the same way
Enter a URL or connect your data, get results. Browse the full collection and find the right analysis for your next project.
Explore All Tools