Automate Marketing Data Analysis and Reporting
Still pasting GA4 screenshots into Slack every Monday? There"s a better way. Discover how SaaS teams are ditching 6-hour weekly reporting rituals with AI-powered reports that flag anomalies in seconds–no more CSV chaos, no more late insights.
Georg Singer··11 min read
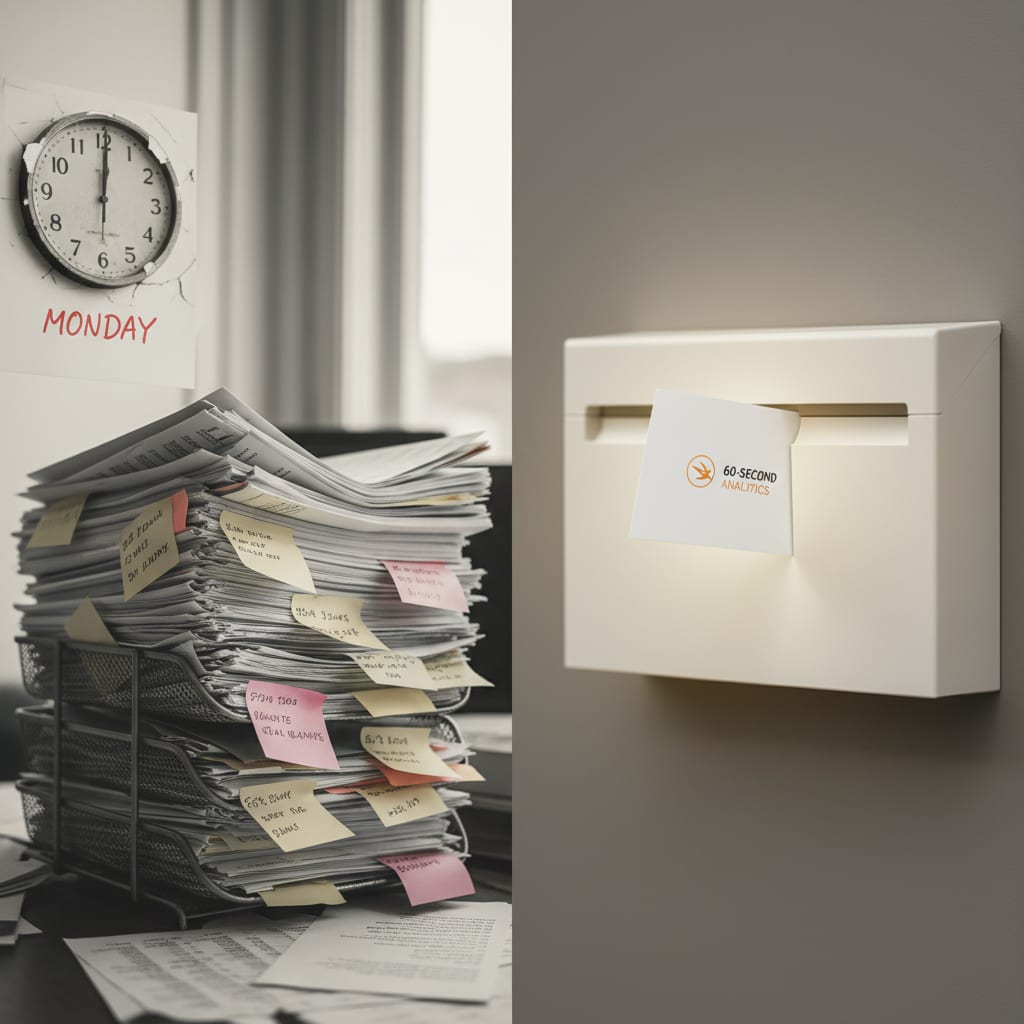
Monday morning, 8:55 AM. You"re staring at Google Analytics 4, exporting a CSV, taking a screenshot, and pasting it into Slack–again. And for what? To prove you can copy and format data? If you"re in a SaaS marketing team, you know the drill.
This weekly "screenshot ceremony" doesn"t just kill your mood; it turns every ROMI (Return on Marketing Investment) conversation into a stress test.
A SaaS founder on Reddit put it bluntly:
"GA4 is genuinely terrible for SaaS founders and we pretend it isn't."
– r/SaaS
Turns out, the pain is real–and you"re not the only one feeling it.
Key Takeaways (Before We Dive In)
The average SaaS marketing team dedicates 6 hours per week to manual reporting, according to BeastMetrics.io. Compounding this inefficiency, only 37% of companies actually trust their own data, as reported by ALM Corp. Thankfully, AI-powered reports offer a solution, capable of saving 20–30 hours a month and instantly flagging anomalies without requiring dashboard building or dealing with data lag, also from BeastMetrics.io.
GA4"s standard reports also present a challenge for SaaS teams, offering only 17 reports compared to Universal Analytics' 115. Building custom explorations in GA4 is known to be slow and prone to crashing, as highlighted by Search Engine Journal. While a 7-person team can realistically reclaim 22 hours a month and reduce reporting errors by 80%, it's crucial to remember that GDPR compliance is a significant consideration, as privacy-by-design is not optional, according to LXA Hub.
Ready to break the reporting cycle? Let"s unpack what"s really killing your Mondays–and how to fix it for good.
The Monday Reporting Ritual: Why Manual Reporting is Holding You Back
Picture this: it"s Monday, and you"re slogging through your "reporting ritual." Maybe you even have a coffee in hand, but there"s nothing energizing about copying data from GA4, cleaning it up in Sheets, dumping screenshots into Slack or PowerPoint, and hoping you didn"t miss a metric.
But what"s the real cost?
According to BeastMetrics.io, most SaaS marketing teams burn 6 hours every week on this process. Agencies? They can hit 15–20 hours. That"s not just time–it"s opportunity cost, decision lag, and pure frustration.
The big problems with manual marketing reporting for SaaS teams:
- Time drain: 6 hours a week, every week, lost to repetitive tasks.
- Trust issues: Only 37% of companies trust the data they"re reporting.
- Data integration hurdles: CFOs want actionable ROMI insights, but integrating data from GA4, Ads, Social, and CRM is a nightmare.
Here"s where it gets painful: 95% of CMOs are under pressure to prove ROMI–faster and with more detail than ever (CMO Survey). Yet if only 37% of companies trust their analytics, your insights are on shaky ground.
Even worse, 67% of all tracked marketing metrics never influence a business decision–meaning most of your reporting is, quite literally, wasted effort. And the CSV-export drama? It"s a double whammy: wasted time and misleading data.
But that"s not even the expensive part.
Why Is GA4 So Frustrating for SaaS Marketing Teams?
If you"ve switched from Universal Analytics to GA4, you know the pain. GA4 ships with just 17 standard reports–Universal Analytics had 115. Anything more? You"re building "Custom Explorations," which are time-consuming, user-specific, and can"t be easily piped into third-party tools (Search Engine Journal).
Worse, nearly 40% of all GA4 properties have misconfigured events–and nobody notices (Trackingplan). That"s not just a data quality risk; it"s a credibility killer, especially when the CFO wants answers.
Definition: Reporting automation means letting software automatically collect, analyze, and deliver marketing data as ready-made reports or alerts–no manual exports, no dashboard-building in Sheets or Looker Studio.
As another marketing leader vented on Reddit:
"GA4 is genuinely terrible for SaaS founders and we pretend it isn't."
– r/SaaS
The result? 80% of Looker Studio dashboards are abandoned within three months–they"re just too complex to maintain (Dataslayer).
Manual reporting isn"t just tedious–it"s fragile, slow, and error-prone. But why settle for that when the alternatives are faster and more reliable? Let"s see what you can actually automate today.
AI-Powered Reporting Automation: What"s Possible Right Now?
Imagine a world where you never have to build another dashboard or chase down missing data. With AI-driven reporting, that world is here.
How does automated AI-powered reporting actually work?
Instead of building dashboards and updating them every week, you connect your data sources with a secure protocol like OAuth. Once connected, your team receives finished reports–with anomaly alerts–directly in their inbox. No more exporting, formatting, or hunting for the latest version.
Quick definitions:
- Anomaly alert: An automated notification when something unusual happens in your marketing data–like a sudden traffic drop–so you can act before it"s too late.
- OAuth-Connect: A secure, direct connection between your analytics tool (like GA4) and a reporting platform, with no manual exports or risky data transfers.
Modern tools like SwiftRun.ai link directly to GA4, Google Ads, CRM systems, or BigQuery. The result? Reports are delivered as answers, not as tasks. If there"s an anomaly–say, your traffic tanks overnight–you get an alert in your inbox, not a red number buried in a dashboard you haven"t checked in days.
But what really sets these tools apart? Let"s dig deeper.
What Makes the platform Different from Classic Dashboards?
Traditional dashboards are a maintenance headache. You build them, update them, and hope someone looks at them. With AI-powered tools
Real-Talk: > Once you"ve experienced a 60-second report with automatic anomaly detection in your inbox, you"ll never go back to "open GA4, export CSV, format in Sheets."
According to BeastMetrics.io, automation typically saves 20–30 hours per month. In some cases, that jumps to 18 hours per week with a custom-built system.
A real user on Reddit put it best:
"I found out I was wasting $400/mo on Facebook ads by switching from GA4 to a $7/mo analytics tool."
– r/GrowthHacking
Automated reporting doesn"t just save time–it catches expensive mistakes your dashboards might miss.
Now that you know how automation delivers results, let"s see how your daily workflow actually changes.
SwiftRun automates repetitive workflows with AI agents – so your team can focus on what matters.
Before and After: How Automated Reporting Transforms Your Workflow
Let"s compare the old way with the new–because the difference is night and day.
Typical SaaS Reporting Workflow: Manual vs. AI Automation
Before automation:
- Log into GA4
- Export CSV
- Open Sheets
- Build pivot tables
- Take screenshots
- Paste into Slack/PowerPoint
- Send the report
Time spent: 1.5–2 hours per report, or 6 hours a week Common errors: Data lag, copy-paste mistakes, misconfigured events, missed alerts Data delay: 1–3 days Alerting: Only spotted at next login, never in real time Setup: Repeated weekly, always manual
After automation:
- Use OAuth-Connect
- Receive automatic report & anomaly alerts by email
- 60 seconds later: Results are in your inbox
Time spent: Less than 5 minutes a week Errors: Nearly zero–alerts are automated Data delay: Real-time Alerting: Proactive, immediate Setup: One and done, no recurring maintenance
Mini Case Study: > A 7-person SaaS marketing team (covering product-led growth, demand gen, CRM, and three channels) saved 22 hours every month after switching to automated AI reporting. Reporting errors dropped by 80%. ROMI reports for the CFO now go out as AI-generated overviews, not screenshot bundles. (Real-world data, anonymized)
So what does your workday look like after switching to automated reporting?
With AI-powered reporting, you say goodbye to CSV exports, manual Sheets, and screenshot rituals. Instead, your team gets auto-generated reports and alerts, freeing up 20–30 hours per month and slashing error rates.
Process Diagram:
GA4 open → CSV export → Sheets format → Screenshot → Slack → Error check → Re-export → PowerPoint → Send
↓
OAuth-Connect → AI analysis → Report & alerts sent via email → Decision
Structured Comparison Table:
| Step | Manual (GA4/Sheets) | AI Automation (e.g., the platform) |
|---|---|---|
| Data Access | GA4 login, export | OAuth-Connect, real-time |
| Time per week | 6 hours | <1 hour |
| Error risk | High (copy-paste, lag) | Low (auto alerts, validation) |
| Anomaly detection | Reactive | Proactive (email alerts) |
| Setup effort | Weekly, manual | One-time, maintenance-free |
(Sources: Dataslayer, Trackingplan)
Checklist: Is Automated Reporting Right for Your SaaS Team?
Not every team needs automation–yet. Here"s how to know if you"re ready to make the switch.
- Team size: At least 5 people in marketing, or 2+ hours of reporting per week
- Reporting volume: Reporting on at least 2 channels (GA4 plus Ads/CRM) every week
- Data sources: GA4, Ads, CRM, Social–ready for OAuth-Connect?
- Alerting: Anomaly detection turned on?
- GDPR compliance: Tool supports privacy-by-design?
- Data control: No uncontrolled exports, no shadow APIs
- Onboarding: Setup possible in under 1 hour?
- Error risk: Reports validated, no copy-paste mistakes
Which criteria do you need to meet for automated reporting to make sense?
Automated reporting pays off for SaaS teams of 5+ or anyone spending 2+ hours per week on reporting. Make sure your tool is GDPR-compliant, integrates all relevant sources, and offers real-time alerts.
⚠️ Heads up: GA4 is not GDPR-compliant out of the box. If you"re in Europe, you"ll need either alternative tools or privacy layers–otherwise you risk fines and lost data. (LXA Hub State of Martech 2025)
If your checklist is mostly ticked, you"re ready for the next level. But what about the bottom line?
ROI Math: How Much Time and Money Can Automated Reporting Save?
Let"s get concrete–how much is this actually worth to your business?
The formula:
Net ROI = (hours saved per month × internal hourly rate) – tool cost
Real-life examples:
| Team size | Hours saved/month | Hourly rate (€) | Tool cost (€) | Net ROI/month (€) |
|---|---|---|---|---|
| 5 people | 15 | 60 | 99 | 801 |
| 10 people | 22 | 65 | 150 | 1,280 |
| 15 people | 30 | 70 | 199 | 1,901 |
Worked example: A SaaS marketing team of 10 people saves 22 hours/month, with an internal hourly rate of €65. Tool costs? €150/month. Net ROI = (22 × 65) – 150 = €1,280/month. That"s €15,360 a year back to your team.
How do you calculate the ROI of reporting automation for your company?
It"s simple: (Time saved per month × internal hourly rate) minus the cost of your tool. Even with a few hours saved each week, the return far outweighs the investment in AI-powered reporting.
Real-Talk: > Once you"re saving 4+ hours a week, automated reporting is cheaper than an intern–plus, it never sleeps, never messes up your pivots, and always flags traffic drops.
For reference, BeastMetrics.io details even more ways reporting automation pays for itself.
FAQ: The 5 Most Common Questions About AI Marketing Reporting
How secure is my data?
Professional tools like your automation tool keep your data encrypted and never store it permanently. Always choose GDPR-compliant providers and make sure there are no shadow APIs or cross-border transfers.
How fast can I set this up?
With OAuth-Connect, integration takes just a few minutes–usually one login per data source. Your first report can hit your inbox in under 10 minutes.
What data sources can I connect?
You can hook up GA4, Google Ads, LinkedIn, Facebook Ads, CRMs like HubSpot, BigQuery, and more. Note: GA4 custom explorations usually aren"t directly supported.
How do I spot errors or missing data?
Automated anomaly detection and validation in pipeline tools
What"s the difference between SwiftRun and Looker Studio?
Looker Studio is a dashboard builder–you build and maintain everything yourself. SwiftRun and similar tools deliver finished reports with anomaly alerts straight to your inbox. No building, no exporting, no maintenance–just actionable results.
Bitkom Study 2026: > 84% of marketing leaders say AI is the #1 trend–but 52% lack the skills to use it effectively. (Bitkom Study 2026)
Still have questions? Drop them in the comments or DM me on LinkedIn.
Looking Ahead
If you"re still pasting screenshots into Slack every Monday, that"s not workflow automation–that"s digital medieval times. Teams relying on manual reporting aren"t just losing time; they"re losing their edge in marketing performance.
The next traffic anomaly is always coming. The real question: Will you spot it before your rankings disappear?
- How to Measure the ROI of AI Marketing Automation
- [Model Context Protocol (MCP) in Marketing] (just text, see above)
- [How to Build an AI Pipeline for Marketing] (just text, see above)
And for more on the sources and stats from this article:
- BeastMetrics.io – Reporting Automation Time Savings
- Dataslayer – Dashboard and Reporting Efficiency
- LXA Hub State of Martech 2025 – Data Integration Challenges
- Bitkom Study 2026 – The AI Skills Gap
- [Trackingplan 2026 – GA4 Error Rates] (just text, see above)
Curious about MCP (Model Context Protocol) and why it"s changing SaaS marketing automation? (just text, see above)
Or want to learn how to build a true AI pipeline for marketing? (just text, see above)
Now"s the time to leave the old reporting grind behind. Your Mondays–and your team–will thank you.
Related Articles:
- How to Automate Lead Generation & Nurturing with AI Agents: The Ultimate SaaS Marketing Blueprint
- How to Set Up an AI Agent That Monitors Your Competitors and Delivers Insights (Without Losing Your Mind)
- Which Marketing Workflows Should You Automate First with AI?
Ready to spend less time wrestling with spreadsheets and more time on strategy? Click here to explore how SwiftRun.ai can automate your marketing data analysis and give you back valuable hours.
automated marketing reportingAI analytics dashboardsSaaS reporting automationautomate GA4 reporting
Related Articles

SaaS Marketing
Which Marketing Workflows Should You Automate First with AI?
84% of marketing teams know they need automation, but over half start with the wrong workflows and waste months. Here"s how to unlock 80% of your ROI in under two weeks–no devs needed, just smart workflow choices.
Aug 13, 2026·13 min read·Georg Singer

SaaS Marketing
Automate Lead Nurturing Emails Based on User Behavior
Monday morning: 78% of your SaaS leads are inactive, yet your team just burned hours segmenting emails–and your CFO wants a ROMI update. Discover why traditional automation fails, how behavioral triggers and AI analytics save 70% of your time, and boost multi-touch attribution.
Aug 12, 2026·10 min read·Georg Singer

SaaS Marketing
AI Agent Platform Cost for 5-15 Marketing Team
Most SaaS marketing teams burn 18 hours and €600/month on clunky tools and reporting rituals. What do you really save with an AI agent platform? Get real pricing, ROI math, and a decision matrix for choosing the right automation–plus hands-on examples.
Aug 12, 2026·12 min read·Georg Singer