Agile Capacity Planning: 45-Min Ops Sprint Guide
75% of PMs are stuck with too few resources–because Ops teams copy-paste Scrum capacity planning. Here"s the formula, template, and 5-step process that saves you 45 minutes per sprint (not 4 hours), and finally makes your capacity real.
Georg Singer··15 min read
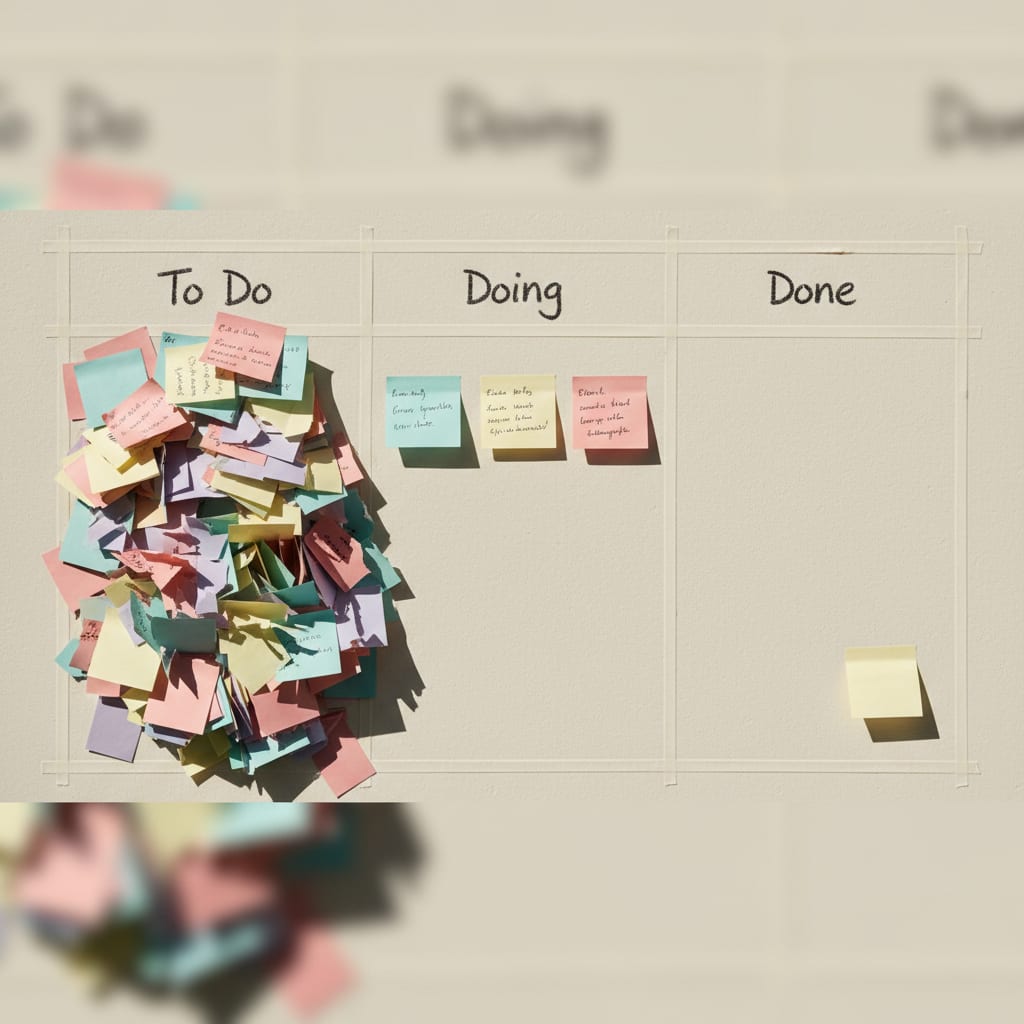
You know the drill: you tally up your team"s available hours, subtract vacations and meetings, divide by your average story-point velocity, and call it a plan.
Sounds good–until Tuesday hits.
"Feeling overwhelmed by our over-dependence on SaaS."
–Ops PM on Reddit, r/SaaS, 57 upvotes. Zero comments with real solutions.
Then–bam–three urgent requests drop on your desk out of nowhere. None of them existed during last week"s sprint planning. By Tuesday afternoon, your carefully crafted capacity spreadsheet is already a relic.
Here"s the kicker: Your planning isn"t broken. Your framework is.
You"re applying a dev-team model to an Ops reality. You know the symptoms: nobody actually tracks velocity. Sprint reviews happen–with zero numbers. Your Trello board has 200 cards, but no one reads it, because every stakeholder update is just gut feeling anyway.
This guide is your way out. You"ll see how capacity planning truly works for Ops teams: using the right unit (hours, not story points), the right metric (Ad-hoc Ratio, not velocity), and a process that takes 45 minutes per sprint–not four hours. At the end, you"ll have a working Google Sheets setup, a formula to calculate predictable capacity, and a stakeholder template that prevents escalation before it starts.
TL;DR: The Real Ops Capacity Cheat Sheet
Scrum-style capacity planning falls flat for Ops teams because story points measure complexity, not availability; it"s not your team–it"s the wrong metric. The secret number is Ad-hoc Ratio, typically 30–70% depending on your team type, and most teams never track it, nearly all underestimating it. The simple formula is Net hours × (1 – Ad-hoc Ratio) × 0.85. In real life, a 5-person team gets, at best, 143 out of 400 calendar hours for planned work (just 36%); if you plan for 200, you"re setting yourself up to fail. The full system takes just 45 minutes per sprint, spread across the sprint start, middle, and end.
Why Scrum Capacity Planning Fails for Ops Teams
Imagine this: You"re running a two-week sprint, and you"ve meticulously mapped out everything using Scrum"s best practices. But Ops isn"t Dev. The reality? Scrum capacity planning was built for feature teams, not support or operations.
Here"s why that matters.
The Scrum.org Sprint Capacity Planning Guide was designed for software dev teams. That"s by design, not by accident. Dev teams work from a well-defined backlog–features are described, estimated, prioritized. Complexity changes, but the flow is steady enough to measure velocity and plan future sprints.
Ops teams live in the opposite world.
Most Ops requests aren"t all that complex–a support ticket here, a process doc there, a stakeholder report. But the volume and timing? Completely unpredictable. You don"t get neat backlogs; you get drive-by requests from every direction, at any time, in every possible flavor of urgency.
And here"s the killer: SLA commitments don"t wait for your next sprint.
Meanwhile, "work about work"–chasing statuses, prepping updates, toggling between tools–eats a huge chunk of your day, but never shows up in JIRA. According to Asana"s research, 60% of knowledge workers" time is lost to this overhead. Only 27% goes to actual skill-based work. That means you lose almost two-thirds of your talent to tasks that generate zero forward momentum.
And with the average SaaS Ops team juggling 87 different tools (saasoperations.com), you"d expect more clarity. Instead, you get 87 dashboards and no real insight into your actual capacity.
Let"s break it down:
Here"s how capacity planning looks when you stick with the Scrum model versus what actually works for Ops:
| Criteria | Dev Team (Scrum) | Ops Team (The Real Way) |
|---|---|---|
| Planning Unit | Story Points | Net Hours |
| Input Data | Sprint Backlog, Velocity | Ad-hoc Ratio, SLA Capacity, Overhead |
| Buffer Logic | Optional, 0–10% | Structural, 15% |
| Update Rhythm | Once per sprint | Start + Mid + End of Sprint |
| Stakeholder Communication | Product Owner buffer | PM speaks in hours, directly |
| Tool Requirement | Jira, Linear, etc. | Google Sheets is enough |
Here"s the consequence:
In Plaky"s 2026 PM stats, 75% of project managers say they"re constantly asked to do too much with too little. Why? Because capacity is guessed, not measured–and the guesses are based on a model built for someone else"s team.
Now, let"s dig into what Ops teams actually need to measure.
The 4 Inputs Ops Teams Really Need for Capacity Planning
So what should you actually be tracking to plan capacity in an Ops team?
Forget story points and velocity. They don"t capture the chaos of your day-to-day. Instead, you need these four inputs:
- Net Available Hours (after subtracting meetings and vacations)
- Historical Ad-hoc Ratio (the true percentage of unplanned requests)
- SLA-blocked Capacity (hours tied up by non-negotiable response times)
- A 15% Buffer (for surprises–because 10% is never enough)
Let"s walk through each.
Input 1: Net Available Hours
Not calendar hours, not contract hours–NET hours. Take your gross working hours and subtract everything that doesn"t directly produce output: regular meetings, 1:1s, company-wide calls, admin tasks, onboarding. For most Ops teams, this overhead eats up 30–40% of your gross hours. So, from 80 working hours per person in a two-week sprint, you"re usually left with just 48–56 net hours.
Input 2: Historical Ad-hoc Ratio
Here"s the big one.
The Ad-hoc Ratio is the percentage of tickets in a sprint that were unplanned. If your ratio is 40%, only 60% of your time is truly plannable–even before subtracting overhead and buffer.
Most teams have no idea what their real Ad-hoc Ratio is. They guess–usually too low. We"ll fix that soon.
Input 3: SLA-Bound Capacity
What percentage of your work is locked in by Service Level Agreements? These are the tasks you can"t push back: hard response deadlines, unmovable commitments. Treat these as non-negotiable blocks in your planning, not afterthoughts. Often, these eat up 15–25% of your net capacity. Ignore them at your peril.
Input 4: The 15% Buffer–Why 10% Just Doesn"t Cut It
A 10% buffer covers estimation errors and planned wiggle room. But another 5% is your insurance against real chaos: escalations, surprise stakeholder requests, that bug that lands on your desk at 4:59pm. Teams running above 90% capacity see higher error rates and burnout risk. This isn"t a comfort buffer–it"s risk management.
Consider this: ProProfs" Workflow Automation Stats show 50% of Ops teams spend at least a full day each month manually compiling project status info. That"s a symptom of missing capacity tracking. If no one knows the real numbers, alignment overhead is inevitable.
Ready to make this practical? Next up: how to actually measure your Ad-hoc Ratio.
Step 1: Measuring Your Team"s Ad-hoc Ratio (The 2-Sprint Method)
Most teams guess their Ad-hoc Ratio–and almost all are wrong. Here"s how to measure it in under 30 minutes.
Here"s what you do:
- Open your ticket system.
- For the last two sprints, tag every ticket as either "planned" (was in sprint planning) or "ad-hoc" (arrived after planning).
- Even with busy boards, this shouldn"t take more than half an hour.
The formula:
Ad-hoc Ratio = (Number of ad-hoc tickets / Total tickets) × 100
Typical values by team type:
| Team Type | Typical Ad-hoc Ratio |
|---|---|
| Support Ops Team | 50–70% |
| Internal IT Ops | 30–50% |
| Product Ops | 20–40% |
Notice how much these numbers swing? That"s because different Ops teams face wildly different levels of unpredictability. A support team"s world is nothing like a product ops team"s.
Why two sprints, not one?
A single sprint can get skewed by a big launch, an incident, or a quarterly report. Two sprints smooth out the noise for a more reliable baseline. Six sprints is even better, but you can start with two and refine from there.
"Most teams underestimate their ad-hoc ratio by 10–15 points. If you"re guessing 25%, odds are you"ll measure 40%."
–Georg Singer, capacity planning coach
And here"s another reality check: BetterCloud"s State of SaaS found 60% of IT teams in SaaS are buried under manual tasks, despite ever-growing tool stacks. Much of that is unplanned work that never gets measured–and so it never makes it into your capacity planning.
Now that you know how to measure chaos, let"s see how to turn it into numbers you can use.
Step 2: Calculating Capacity in Hours–The Ops Formula
So how do you turn all that chaos into a number you can actually plan around?
Here"s the formula for plannable capacity:
Net Hours × (1 – Ad-hoc Ratio) × 0.85
This gives you the portion of your team"s time that"s genuinely available for planned, strategic work.
Let"s run through a real-world example.
Example: 5-person Ops team, 2-week sprint
5 people × 80 hours = 400 gross hours
minus 30% meeting overhead = 280 net hours
with 40% ad-hoc × 0.6 = 168 planned hours
minus 15% buffer × 0.85 = 143 plannable hours
Out of a theoretical 400 hours, only 143 hours are realistically available for planned work–just 36%.
Most PMs are shocked by that number. But it explains why sprint plans with 200 hours of work for a 5-person team are doomed from the start.
See how it plays out across scenarios:
| Team Size | Ad-hoc 30% | Ad-hoc 50% | Ad-hoc 70% | |---|---|---| | 3 people | 104 h | 74 h | 44 h | | 5 people | 173 h | 124 h | 74 h | | 10 people | 346 h | 247 h | 148 h |
If your 5-person support team has a 70% ad-hoc ratio, you get just 74 hours per sprint for planned projects. Assign them 150 hours? Delivery will slip–guaranteed.
Asana"s Anatomy of Work Index shows the upside: better process can win back 4.9 hours per week per knowledge worker–six full workweeks per year. But you only get that if you first admit how much time you"re really losing.
Next, let"s make this operational with a dead-simple template.
SwiftRun automates repetitive workflows with AI agents – so your team can focus on what matters.
Step 3: Setting Up the Google Sheets Template
No macros. No scripts. No shiny new SaaS tool. Just three tabs you can set up in five minutes.
Why not use the hottest new app? Because, according to Lokalise"s Tool Fatigue Productivity Report, employees switch between apps 33 times a day on average. All that context switching can vaporize up to 40% of your productive time. Keep your template where your team already works.
Tab 1: Team Configuration (one-time setup)
- Team member name
- Contracted hours per week
- Fixed meeting overhead (per sprint)
- SLA commitments (hours per sprint)
This tab rarely changes, but it"s your single source of truth. Profisee says 37% of companies lack a true source of capacity data. If someone drops to 32 hours for two sprints and you don"t update Tab 1, you"ll realize too late–when the sprint"s already gone off the rails.
Tab 2: Sprint Capacity (update every sprint)
- Sprint number
- Absences per person (hours)
- Plannable capacity (auto-calculated)
- Projects assigned with hour estimates
- Utilization % with color code:
- 🟢 under 80%: sprint-ready, open to new requests
- 🟡 80–95%: at the limit, communicate immediately
- 🔴 over 95%: overloaded, stakeholders must be informed
Tab 3: Ad-hoc Tracking (continuous)
Most teams add this last. Don"t make that mistake.
- Date
- Request description
- Type (ad-hoc / planned)
- Actual hours spent
- Source (who requested)
This is the heart of your system. Tab 3 lets you continuously update your Ad-hoc Ratio, so you"re never flying blind. It also reveals which stakeholders drive the most surprise work–a goldmine for productive alignment conversations.
With your template live, it"s time to talk about the hardest part: saying no (and yes) to stakeholders.
Step 4: Communicating Capacity–Your Stakeholder Transparency Template
Every PM dreads it: telling a stakeholder "no" (or "not this sprint").
But what if you could replace hand-waving with data?
Here"s how you make your limits clear, without the drama:
- Be transparent with numbers: "Sprint 12 has 143 plannable hours, 128 are assigned. Request XY is logged for Sprint 13."
- This swaps out "We"re overloaded" for a concrete update and timeline. Escalations drop, because expectations are set early.
The biggest mistake? Knowing your capacity, but never sharing it until the sprint"s already off the rails.
The 3-Line Update–Sprint Start Template:
Sprint [Number] | Team [Name]
Plannable capacity: [X] h | Assigned: [Y] h ([Z]%)
[🟢 New requests welcome / 🟡 No wiggle room / 🔴 Overloaded]
Next available slot: Sprint [Number + 1]
Over-Request Response ("No, but…" Template):
Hi [Name],
Request "[Description]" is logged. Sprint [current] is fully assigned with [X] h.
I"ll queue [Request] for Sprint [next]–planned start: [Date].
If it"s urgent, let"s discuss trade-offs against [other request].
When to send:
At the very start of each sprint–not the end. If you wait until the end, expectations are already set and you"re left explaining failure, not managing priorities.
Here"s the gap: Scrum assumes the Product Owner shields the team from overload. In most Ops teams, there is no such buffer–the PM is the buffer. The 3-line update is your shield, in text form.
Get in front of the problem, and you"ll avoid the cycle Dejan Majkic describes: 70–80% of retro action items never get done–not for lack of intent, but because there was never capacity to do them. The templates above break that loop with proactive, visible communication.
Step 5: Baking Capacity Planning Into Your Sprint Cycle–The 45-Minute Routine
What if capacity planning could just be... easy?
Total time: 45 minutes per sprint. Not per day. Not per week.
Month 1: Build Your Baseline
Sprint Start (Day 1) – 25 minutes
- Fill in Tab 2: note absences, check calculated plannable capacity
- Send the 3-line update to relevant stakeholders
Sprint Middle (Day 5–7) – 10 minutes
- Check Tab 3: How many ad-hoc requests since sprint start?
- If you"ve burned through >120% of expected ad-hoc hours, flag it immediately–don"t wait for the sprint review
Sprint End (Last day) – 10 minutes
- Enter new ad-hoc ratio in Tab 3
- After 5 sprints, you"ll have a solid baseline for stakeholder conversations ("Our team historically runs at 45% ad-hoc. That"s data, not opinion.")
Month 2: First Real Planning Cycles
By now, your ad-hoc ratio is stabilizing. Patterns emerge: which stakeholders drive surprise work? Which request types always show up ad-hoc, though they could be planned? This is the classic "retro-to-sprint gap"–action items that never get done, because there"s never time. Flow metrics like cycle time become visible, as Tab 3 tracks real hours by request type.
Month 3: Stakeholder Communication as Habit
The 3-line update is now routine. Stakeholders start asking "When"s the next slot?" instead of "Do you have capacity?" That"s a huge mindset shift: now you"re talking predictive resource allocation, not reactive firefighting. When multiple Ops teams compete for the same resource pool, capacity planning becomes your prioritization tool.
The Asana Anatomy of Work Index backs up the ROI: building this system takes 3–4 hours upfront and pays for itself by Sprint 2, thanks to reduced coordination hassle.
SwiftRun.ai automates the sprint tracking and capacity math you just built manually. The template is still your foundation–but SwiftRun connects it to your ticket data and auto-generates your stakeholder update. See if it fits your team in 10 minutes.
⚠️ The 3 Most Common Mistakes–and How to Dodge Them
Everyone slips up. But three mistakes will tank your ops capacity planning faster than any other.
⚠️ Mistake 1: Planning for 100% Capacity
When you start the sprint at over 90% utilization, you don"t get more done–you just shift work into next sprint, lose quality, and rack up rework. That buffer isn"t comfort–it"s risk management.
Some stakeholders see buffers as wasted resources. Counter with the data: teams above 90% utilization see higher error rates and burnout risk. Freshworks" Cost of Complexity Report 2025 found that software complexity costs companies 7% of annual revenue–missing capacity buffers are a direct driver.
⚠️ Mistake 2: Measuring Ad-hoc Ratio Once, Then Ignoring It
Your ad-hoc ratio was 40% six months ago–now, after a product launch, it"s 65%. If you don"t update every sprint (in Tab 3), your numbers get stale and dangerous. Old ratios are worse than none–they give false confidence.
⚠️ Mistake 3: Treating Capacity Planning as a PM Tool, Not a Team Tool
If only the PM knows the numbers, individuals make promises blindly: "Sure, I"ll take a look." Then the PM, knowing the sprint"s already at 110%, has to break the bad news. Action items die because no one else even knows there"s no time for them. The template"s not about controlling people–it"s about making team capacity visible.
One last warning:
Trying to "convert" story points to hours ("1 story point = 4 hours") doesn"t work in real Ops teams. With unpredictable request queues, velocity is meaningless. Hours are real. Use them.
The First Step Is Smaller Than You Think
Open your ticket system. Tag every ticket from the last two sprints as "planned" or "ad-hoc." Thirty minutes, tops. The number you get–almost always 10–15 points higher than you guessed–is the only number you need to start winning every future sprint planning debate with data, not gut feel.
And when you"re ready to prioritize engineering capacity across multiple competing Ops teams, check out "How to Prioritize Engineering Capacity Between Teams" (plain text, since no external link provided).
Keep going:
- What is capacity planning in the agile context, and how do you implement it for Ops teams? (plain text)
- How do you integrate OKRs into agile sprint planning? (plain text)
Author: Georg Singer
Ready to make your capacity real? Start with one simple measurement. And never lose another sprint to wishful thinking again.
Related Articles:
- Why Jira Fails SaaS Ops Teams–and 3 Tools That Actually Work
- How to Seamlessly Connect OKRs to Agile Sprint Planning (Without Adding Meetings)
- How to Fix Product and Sales Alignment in SaaS–Without New Tools
Ready to make your operations sprints fly by and unlock clearer capacity insights? Give SwiftRun.ai a spin today to see how easily you can tackle your Agile capacity planning challenges!
agile capacity planningops team capacityagile ops planningsprint capacity calculationpredictable team capacity
Related Articles

Operations & PM Teams
GTM Misalignment: How to Spot Early Warning Signs in SaaS
GTM misalignment is the #1 reason B2B SaaS companies miss revenue targets, according to Forrester (2025). But Ops PMs see the signals first. Here"s how to recognize, diagnose, and act before the problem hits your bottom line.
Jun 12, 2026·14 min read·Georg Singer

Operations & PM Teams
WIP Limits: Why Ops Teams Ignore Them at Their Peril
23 tasks 'In Progress', only one finished. That"s not bad luck–it"s Little"s Law in action. Here"s why WIP limits are the most important (and ignored) concept for Ops teams drowning in SaaS tools.
Jun 11, 2026·12 min read·Georg Singer

Operations & PM Teams
How to Fix Product and Sales Alignment in SaaS–Without New Tools
Product and Sales misalignment is the #1 reason SaaS revenue targets fail–according to Forrester. It"s a system problem, not a people problem. Here"s a four-part framework to sync Product and GTM, boost adoption, and eliminate wasted launches. No new tools required.
Jun 10, 2026·13 min read·Georg Singer