Early Project Risk Detection: What, Why, How
Up to 80% of retro action items never get done. The same sticky note, sprint after sprint. Early Risk Detection closes this gap–with 5 clear warning signals and measurable thresholds that spot project risks on day 1–3, not after it"s too late.
Georg Singer··16 min read

Why Most Project Risks Only Show Up When It's Too Late
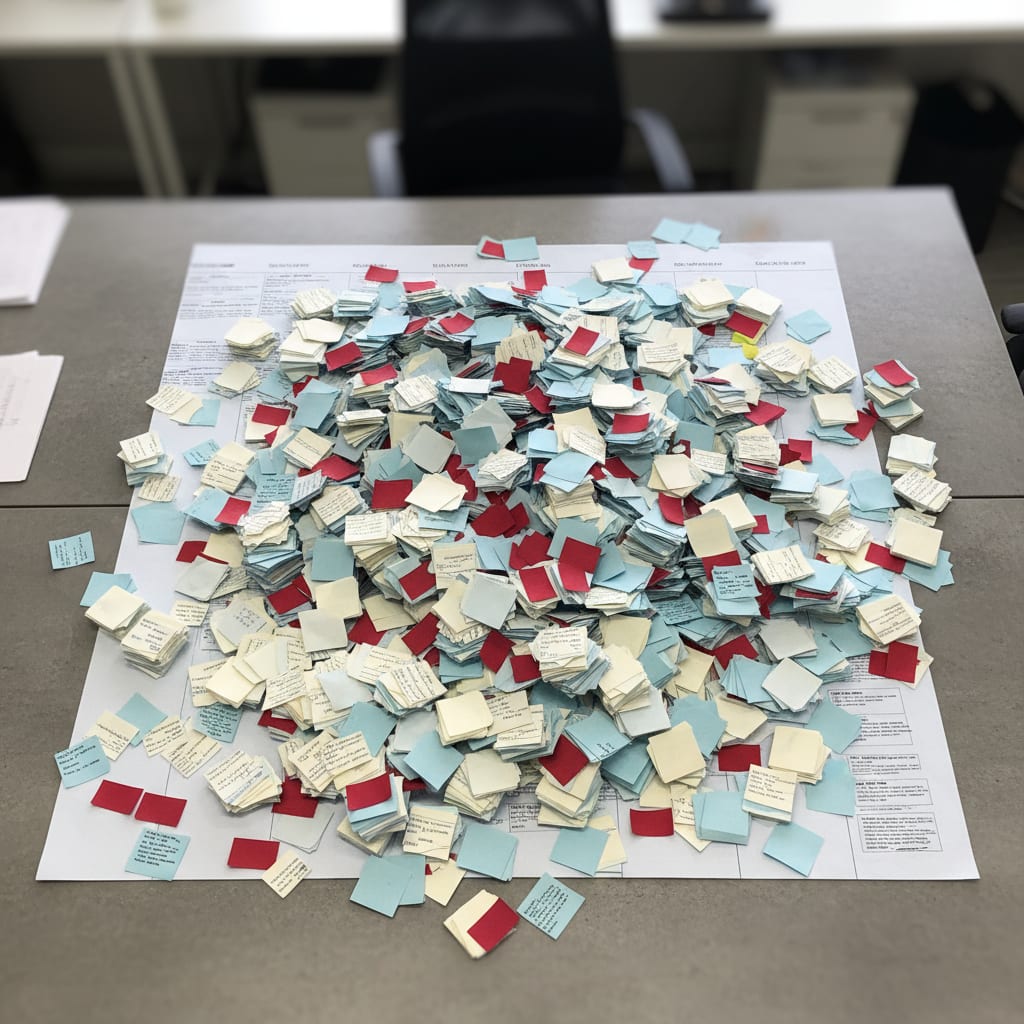
Ever noticed how the same issues resurface sprint after sprint–the same Post-it, the same discussion, no real change? You"re not alone. According to Dejan Majkic (dejanmajkic.substack.com / scrum.org), an eye-watering 70–80% of retro action items are never implemented. That"s not just inertia–it"s a structural gap in how teams spot and act on risks.
But here"s the kicker: this "retro-to-sprint gap" doesn"t start in the retro. The root cause is way upstream–on day 2 of the sprint, when the first warning sign flashes and nobody sees it.
Imagine your team has a recurring problem with estimating task complexity. This shows up in retrospectives as "improve estimation accuracy," but the underlying issues–like a lack of clear acceptance criteria or dependencies on another team–aren't addressed until it's too late, causing delays in subsequent sprints.
And if you think this is just a "team problem," think again. 75% of project managers say they"re asked to do too much with too few resources (Plaky PM Statistics 2026). The warning signs of overload? They show up in week 1, but don"t get treated as real risks until week 3–after the damage is done.
But this isn"t just another "do more meetings" pep talk. The real issue? It"s a metrics problem, not a motivation problem.
TL;DR: What You Actually Need to Know
Burndown charts are often relied upon to spot risks, but they typically reveal issues too late, usually on day 7–8 of a 10-day sprint. This leaves a mere 1–2 days to react, making interventions costly and difficult. Fortunately, five early warning indicators can flag the same risks much sooner, on day 1–3.
These indicators include stale tickets that haven't been updated in 48 hours, a Work In Progress (WIP) ratio exceeding 3, more than two blockers appearing in the first week of a sprint, a velocity deviation greater than 20% in the initial days, and the presence of dependency clusters.
Adding to this challenge, 75% of project managers grapple with chronic resource shortages. While early warning signs for this are present, they are frequently ignored. A significant pitfall to be aware of is alert fatigue; to combat this, it's recommended to start with just two key indicators and calibrate them over 2–3 sprints.
Looking ahead, Gartner predicts that by the end of 2026, 40% of enterprise applications will feature AI agents, presenting a significant opportunity for automated Early Risk Detection (source).
What Is Early Risk Detection–And Why Should You Care?
Imagine being able to spot project risks before they show up on your burndown chart. That"s the promise of Early Risk Detection–a way to catch issues in real time, as soon as the process starts to wobble.
Early Risk Detection means systematically watching for warning signs in your ongoing projects–before they turn into visible delays on your burndown chart. Unlike old-school risk registers, Early Risk Detection uses real, live sprint data: ticket stagnation, WIP overload, velocity slip–not theoretical scenarios.
This is what closes the infamous "retro-to-sprint gap." Instead of waiting for the next retro to dissect what went wrong, you"re seeing the signals as they happen, and you can intervene before things go off the rails.
Reactive vs. Proactive: Why Timing Is Everything
Here"s the traditional approach: before kickoff, you fill out a risk register, estimate likelihood and impact, and hope nothing unexpected happens. It"s not useless–it"s just not built for the pace of sprint work.
A risk register is about what might happen. Early Risk Detection is about what"s happening, right now.
The difference? It"s all about timing. The risk register relies on guesses you make before the sprint begins. Early Risk Detection is grounded in live data–ticket movements, WIP trends, blockers, actual flow. Working reactively means you only respond once the problem is visible. Working proactively means you spot the pattern before it becomes a crisis.
What Early Risk Detection Is Not
Don"t get it twisted: Early Risk Detection isn"t a tool or a dashboard you can just plug in and forget. And it"s not a silver bullet that magically fixes sprint problems. It simply makes those problems visible–sooner.
That might sound minor, but it"s not. Spotting a risk on day 2 vs. day 8 of a 10-day sprint is the difference between a quiet internal fix and a public stakeholder escalation. That"s five or six days of lost reaction time, every single sprint.
So, how do you actually get ahead of the curve?
Why Your Burndown Chart Hides Risks Until It"s Too Late
You probably rely on your burndown chart to spot trouble. Here"s the problem: it only measures story points completed, not the root causes behind delays.
The classic scenario? The burndown curve stays flat until day 7 or 8. By then, your options are expensive and ugly.
But what if you could see why the work isn"t burning down–before the chart falls off a cliff?
The Real Problem with Reactive Metrics
Think of it like driving a car. If you only watch your speedometer, but never look at the road or the mirrors, you"re missing critical context. The speedometer tells you how fast you"re going–but not that there"s a hairpin turn ahead.
Your burndown chart is the speedometer. It reliably tells you how much work is left–but not why you"re behind. And it only reacts once you"re already in trouble.
By the time the curve finally plummets (usually late in the sprint), your choices are all painful:
- Reduce scope (cue stakeholder arguments)
- Ask for overtime (hello, burnout)
- Delay delivery (watch trust erode)
All of which are far more expensive than fixing the root cause early.
What You See vs. What"s Actually Happening
Let"s get concrete. According to the Asana Anatomy of Work (2024, global survey of 10,000+ knowledge workers), 60% of work time gets sunk into "work about work"–chasing status, switching apps, duplicating tasks. That leaves just 27% for real, skill-based work. Think about that: nearly three-quarters of your team"s time is lost to process friction.
Now, look at your Trello or Jira board. Who"s actually reading those tickets? Who"s following up on action items? Your burndown chart doesn"t track any of this.
Before: Burndown Chart as Your Only Guide
The curve looks okay in week 1–it"s gently sloping down. But underneath, two tickets have been "in progress" for 52 hours with zero updates. One dev is stuck waiting for an API doc that"s still missing. Your WIP ratio is 4.2–meaning, on average, each person juggles more than four tasks at once.
None of this is visible on the burndown chart. It won"t react until day 8, by which point you"re out of good options.
After: Early Risk Detection Adds Real Visibility
Now, with Early Risk Detection, the first indicator pings on day 2: Ticket #47 hasn"t moved in 51 hours. Ticket #52 is blocked by an external dependency. WIP ratio is over the threshold. You step in and adjust–days before you"d otherwise notice.
No escalation, no last-minute overtime. Just a quick course correction.
And this isn"t just theory. BetterCloud"s State of SaaS 2025 report (survey of 500+ SaaS IT teams) found 60% still spend excessive time on manual tasks–even with more tools than ever. It"s not about more software; it"s about seeing the right signals, soon enough.
"Feeling overwhelmed by our over-dependence on SaaS" – Reddit r/SaaS
That "overwhelmed" feeling? It"s those tickets sitting "in progress" with no updates–your burndown chart doesn"t tell that story.
SwiftRun automates repetitive workflows with AI agents – so your team can focus on what matters.
The 5 Early Warning Indicators Every Ops PM Needs
Spotting risks early isn"t magic–it"s about tracking the right signals. Let"s break down the five most powerful indicators you can use, with practical thresholds and examples.
1. Stale Tickets: The Silent Sprint Killer
Ever had a ticket that just… stops moving? A "stale ticket" is any project task with no status update for 48+ hours–even if it"s marked "in progress."
Stale tickets are the most reliable (and most ignored) early risk sign. Your burndown chart won"t flag them as blockers–so they sit, quietly sabotaging your flow.
Threshold: Hard stop at 48 hours with no update = trigger an automatic review.
If a ticket hasn"t moved in two days, there"s a problem–either someone knows and isn"t saying, or nobody"s noticed. Either way, it"s a signal for attention (not instant panic).
2. WIP Ratio: When Your Team Is Doing Too Much at Once
How many tickets are "open" compared to your team size? That"s your Work In Progress (WIP) ratio–simply, open tickets ÷ team members.
If that number is above 3, you"re in the danger zone: everyone is juggling too many tasks, and context-switching starts to destroy productivity.
According to the Lokalise Tool Fatigue Productivity Report 2025 (700+ knowledge workers), people switch apps an average of 33 times a day–context switching can nuke up to 40% of productive time.
Threshold: WIP ratio > 3 = capacity problem, not a performance issue.
3. Blocker Density: Counting Your Roadblocks
How many tasks are actively blocked in the first week of your sprint? More than two blockers in sprint week one is a big red flag for delivery delays.
But it"s not just the number–it"s how fast you resolve them. A blocker cleared in 24 hours? No big deal. A blocker sitting there for three days? Serious risk.
Threshold: More than 2 active blockers in week 1 = risk review needed.
Flow metrics like WIP and cycle time rarely make it into sprint reviews–yet they"re the clearest view into what"s really causing delays.
4. Velocity Deviation: When You Fall Behind Your Own Pace
If your burndown curve in the first three sprint days is over 20% behind your historical average, that"s a statistically valid early warning.
But here"s the catch: this only works if you have reliable historical velocity data over several sprints. New to flow metrics? This is the indicator with the longest "ramp up" before you can trust it–most PM tools can"t track this out of the box.
Threshold: >20% deviation from historical velocity in days 1–3.
5. Dependency Clusters: The Invisible Roadblocks
Maybe the trickiest risk of all: tickets waiting on outside teams, vendors, or other departments. These "dependency clusters" look "open" on your board, but are effectively dead in the water.
They appear healthy on your chart, but can"t move forward until someone else acts.
Threshold: Any ticket with an unresolved external dependency at the end of day 3 = active risk.
None of these five are visible on your vanilla burndown chart. But together, they give you a live radar for sprint trouble.
How to Actually Set Up Early Risk Detection (In 4 Steps)
Let"s get real for a second. Ops teams in SaaS use an average of 87 tools (saasoperations.com). And yet, half spend at least a full day every month just cobbling together project status by hand (ProProfsProject survey). That"s "work about work" in its purest form.
A solid Early Risk Detection setup doesn"t just spot risks earlier–it cuts down on all this reactive clean-up.
Here"s how to put it into practice, step by step:
Sprint starts → Thresholds are set → Daily check (2 questions) → Indicator triggers → Escalation protocol kicks in → Retro calibrates thresholds
How Does Early Risk Detection Work, Day to Day?
You"re tracking five indicators: stale tickets (48h rule), WIP ratio >3, more than 2 active blockers in week 1, velocity deviation >20% in days 1–3, and any unresolved external dependencies by day 3. None of these are visible in standard burndown charts.
So how do you operationalize this?
Step 1: Define Measurable Thresholds–No Gut Feel
For each indicator, set a clear threshold before the sprint begins. Not "let"s see if it gets bad," but: "Any ticket >48h without update = flagged as blocker, PM gets notified." Put it in writing, everyone can see it.
Sounds process-heavy? In reality, it replaces a pile of Slack DMs and the classic standup line: "I thought that was still moving."
Step 2: Add Two Quick Risk Checks to Your Daily Standup
No need for a new meeting. Just add two razor-sharp questions:
- "Are there any tickets that haven"t moved since yesterday?"
- "Which external dependencies are still unresolved?"
No fluff, no extra overhead–just focus on surfacing signals that usually get lost in the shuffle.
Step 3: Have an Escalation Protocol–Before You Need It
When an indicator triggers: who acts? How? Who gets looped in? Stakeholders hate surprises.
Your protocol needs to exist before the first incident–not after. If you"re writing it in the heat of the moment, you"re improvising, not managing.
Step 4: Use Your Retrospective as a Feedback Loop
After every sprint, review: Which indicators caught real risks? Which were false positives? Were thresholds too tight or too loose?
Plan for a 2–3 sprint "calibration phase." In this window, you track indicators but don"t escalate automatically–just observe and adjust.
Implementation tip: Start with just 2 indicators. If you try all five at once, you"ll be drowning in alerts by sprint 2. Start with stale tickets (48h rule) and WIP ratio–both can be measured from your existing board, no extra data needed.
Checklist for Launching Early Risk Detection:
- Threshold for stale tickets defined (recommendation: 48h)
- WIP ratio formula set up and baseline measured
- Two standup risk questions added to the agenda
- Escalation protocol documented (who, how, to whom)
- Retro agenda includes indicator review
- Calibration phase planned for 2–3 sprints
Once you"ve nailed these basics, you"re ready for bigger automation and AI-driven detection. But first, you"ll need to avoid the #1 implementation trap…
Too Many Warnings = Nobody Listens: The Alert Fatigue Trap
You might be thinking: "If we flag every little thing, won"t people just start ignoring the warnings?" And you"d be right.
Alert fatigue is well documented in IT security–and it"s just as real in project management, even if nobody talks about it. Software complexity costs businesses an average of 7% of annual revenue, and 53% never get the ROI they expect from their tools (source). If your Early Risk Detection system becomes too noisy or complex, you"ll just recreate the same problem.
The Real Problem: False Positives Everywhere
Your first round of thresholds will almost always be wrong. That"s not a failure–it"s just how measurement works. A four-person team handling lots of tiny tickets will have a totally different WIP ratio than a two-person team working on massive tasks.
The real mistake? Enforcing thresholds and escalating before you"ve learned what "normal" looks like for your team.
How to Prevent Alert Fatigue from Day One
⚠️ Heads up: If your team feels like they"re being watched, they"ll start gaming the system–manually moving tickets to "in progress" just to avoid triggers. That"s the opposite of what you want. Team buy-in isn"t a soft skill–it"s a functional prerequisite.
Three rules to dodge alert fatigue:
- Learning period before escalation: For the first 2–3 sprints, observe indicators and talk about them in the team–but don"t auto-escalate.
- Signal ≠ alarm: Early Risk Detection is about trends, not panic. Not every signal needs immediate action. The PM decides; the indicator just supplies info.
- Simplicity wins: A system with five indicators, three dashboards, and two escalation levels will be ignored by sprint 3. Less is more–stick to what matters.
And don"t toss your burndown chart. It"s not dead. It"s still a great tool for stakeholder comms and sprint reviews. Early Risk Detection doesn"t replace it–it gives the chart context it can"t provide alone.
Quick Comparison: Burndown vs. Early Risk Detection
| Criteria | Burndown Chart | Early Risk Detection |
|---|---|---|
| When risk is visible | Day 7–8 (10-day sprint) | Day 1–3 |
| What"s measured | Completed story points | Behavior patterns in sprint |
| Action window | 1–2 days | 5–6 days |
| Escalation effort | High (stakeholders involved) | Low (internal adjustment) |
| Tool requirement | Native in Jira/Trello/Linear | Custom rules or AI |
Automating Early Risk Detection: When AI Spots Trouble Sooner Than You
Manual monitoring will only get you so far. There"s a blind spot no daily standup can cover: if your PM is in meetings, on vacation, or just asks the wrong questions, risks slip by.
This isn"t about skill–it"s a capacity problem. If your PM is juggling five projects and has to check five boards for stale tickets every sprint, they"ll burn out fast.
What AI-Driven Early Warning Systems Do Differently
AI systems can spot patterns across multiple sprints that no human ever sees. Maybe blockers always pop up on Wednesdays–because that"s when the backend team has their weekly and ignores outside requests. Or certain ticket types always take three times longer–not because the team is slow, but because the estimates are structurally wrong.
But here"s the catch: 37% of companies have no single source of truth for their data (Profisee). If you don"t have unified project data, automated Early Risk Detection just isn"t possible–you need a baseline for thresholds to mean anything. Data consistency is the starting point, not the end goal.
Gartner predicts that by end of 2026, 40% of all enterprise apps will include task-specific AI agents–up from less than 5% in 2025 (source). Early warning in project management is one of the first real use cases–because the data"s already there, and all you need is a system to analyze it.
Agentic AI doesn"t just summarize data–it actively flags risks and notifies the PM before they even look.
Board data → Checked against thresholds → Automatic alert → PM acts on day 2, not day 8
SwiftRun.ai is an example: it analyzes your existing Trello data against configurable thresholds–no new tool, no manual dashboard scraping.
SwiftRun.ai turns your project data into instant early warning signals–no exports, no copy-paste. Connect your Trello board and see, in 60 seconds, which risks your last sprint showed as early as day 2.
What Early Risk Detection Can (and Can"t) Do for You
Let"s zoom out. Asana"s Anatomy of Work (2024) found that better processes could claw back 4.9 hours per week for knowledge workers–that"s over six weeks a year. For a PM managing three projects, that"s a real, measurable gain. But you need consistent data and well-tuned thresholds to get there.
If you"ve been with your team for years, you probably spot risks intuitively. Systematic indicators aren"t meant to replace gut feel–they"re crucial for new teams, high turnover, or when you"re running multiple squads and can"t keep all the context in your head.
One caveat: teams not using story points will need to adjust their WIP ratio and velocity deviation formulas. If you estimate in hours or ticket count, you can still apply these metrics–just recalibrate the thresholds. Blindly importing dev team rules won"t work.
Early Risk Detection isn"t a magic wand. It just makes problems visible sooner. You still have to act. The indicator informs; the PM decides.
And your Thursday burndown chart? You can keep it. From now on, it won"t tell you anything you didn"t already know days ago.
Further reading:
- Plaky PM Statistics 2026
- BetterCloud State of SaaS 2025
- Lokalise Tool Fatigue Productivity Report 2025
- Gartner: 40% of Enterprise Apps Will Feature Task-Specific AI Agents by 2026
- Freshworks Survey: Software Complexity
Related Articles:
- What Is Operational Intelligence–and Why Are SaaS PM Teams Making Bad Calls Without It Every Single Day?
- How to Actually Get Retro Action Items Done Next Sprint (and Stop Wasting Time)
Ready to get ahead of project risks and keep your projects on track? Visit SwiftRun.ai to learn how we can help you identify potential issues before they derail your progress.
early risk detection project managementproject early warning systemburndown chartsprint risk managementWIP ratio project management
Related Articles

Operations & PM Teams
GTM Misalignment: How to Spot Early Warning Signs in SaaS
GTM misalignment is the #1 reason B2B SaaS companies miss revenue targets, according to Forrester (2025). But Ops PMs see the signals first. Here"s how to recognize, diagnose, and act before the problem hits your bottom line.
Jun 12, 2026·14 min read·Georg Singer

Operations & PM Teams
WIP Limits: Why Ops Teams Ignore Them at Their Peril
23 tasks 'In Progress', only one finished. That"s not bad luck–it"s Little"s Law in action. Here"s why WIP limits are the most important (and ignored) concept for Ops teams drowning in SaaS tools.
Jun 11, 2026·12 min read·Georg Singer
Operations & PM Teams
How to Fix Product and Sales Alignment in SaaS–Without New Tools
Product and Sales misalignment is the #1 reason SaaS revenue targets fail–according to Forrester. It"s a system problem, not a people problem. Here"s a four-part framework to sync Product and GTM, boost adoption, and eliminate wasted launches. No new tools required.
Jun 10, 2026·13 min read·Georg Singer